Last week, my mentor mentioned that high-voltage power transmission circuits could sometimes be used to provide reactive power support when on potential but off load, particularly for parallel lines. Anecdotally, based on my limited understanding of the Ferranti Effect, this seems perfectly reasonable: light loading on the line results in elevated line charging capacitance, which is then injected to the system at the point of connection.
Ferranti Effect
In order to understand the results, we have to understand the cause behind the Ferranti Effect.
All transmission lines (even the kind discussed in Radiation and Propagation courses) behave the same way once the line length approaches a tenth of the signal wavelength. Due to the relatively low frequency of utility power (60Hz in North America and 50Hz in many other parts of the world), the wavelength is pretty long, so these effects only begin to appear in significantly long (greater than 300km) transmission lines.
The classical model is:

- Source: Wikipedia
Lines of a moderate length (greater than 300km) can be modelled simply as a series resistance, series inductance and shunt capacitance – in Power Systems, we often call this model a “Pi section” (this moniker makes more sense if you separate the capacitance at the sending and receiving ends of the line, dividing them by two). Longer lines (those exceeding 500km) are then an extension of an already-solved problem: they can simply be modelled using multiple moderate-length segments as appropriate.
Keen readers will notice that this is, quite simply, a two-port network model: we can consider each Pi section a black box, with sending-end voltage/current and receiving-end voltage/current. Many of us rely on an approximation of how wires behave: in most applications, they have infinitesimal impedance, and so the impedance may be neglected in calculations. However, when we approach power transmission, the voltages and currents are much higher than experienced elsewhere, which can have quite a profound impact on system operation.
I hope that this brief discussion provided a reasonable introduction or review. If not, the Kathmandu University also has a very good handout on the subject.
Surge Impedance Loading
Based on the telegrapher’s equations and the above model, we can determine the characteristic impedance (also called surge impedance) of the transmission line as:

In all transmission lines, for power or signals alike, optimal power transfer occurs when the load impedance matches the characteristic impedance. In Power Systems, we like to relate these quantities to units Power (Real, Reactive and Apparent) because these quantities can always be directly compared regardless of phase angles, power factors, harmonic distortion levels or voltage levels.
The Surge Impedance Loading converts the characteristic impedance (ohms) into a power (Watts) value:
![]()
If the amount of power being transmitted equals the SIL, the line mutual coupling (the inductance and capacitance in the model) cancels each other out, thus resulting in the line operating at unity power factor. When the amount of power transferred is below the SIL, the power factor is leading (capacitive), and when the amount of power transferred is above the SIL, the power factor is lagging (inductive).
An intuitive model
Intuitively, I understand this behaviour by thinking about the cause of these impedances, though I am not a physicist, so this intuition is best understood as a useful analogy, not as fact. I imagine lines have some slight twist when installed, giving rise to the series inductance. Likewise, lines are conductors of different potential separated by a dielectric (air), which results in some capacitive coupling between lines.
Recall that power loss due to the resistance of a power line can be calculated using Joule’s law:

Similarly, the reactive power absorbed by (or injected from, if Q is negative) a power line into the system can be calculated using (where X is defined as negative for capacitors and positive for inductors):

The inductance is fixed, but the amount of reactive power absorbed by the series inductance is proportional to the current flowing across the line. On a lightly loaded line, or where the receiving end is an open circuit, the current is very small, so the inductive nature of the line is minimized and the capacitive behaviour dominates. Thus, the line is below the SIL and operates with a leading (capacitive) power factor.
Power transmission lines as capacitors
Finally, to get to the real point of this article. Given the above background, it follows that lightly loaded or open-ended lines will inject reactive power. With lightly loaded parallel redundant lines, it is therefore possible to open one line and use it to provide reactive power (var) support for the system.
For my simulation, I used two parallel 230kV lines, each 600km long, with three ideally-transposed phases on each right-of-way (in delta configuration with four bundled sub-conductors). These lines were supplied by an infinite bus (voltage source at 22kVrms line-to-line) with a 22/230kV Wye-Delta transformer. At the receiving end, a 300MW+5Mvar load was installed.
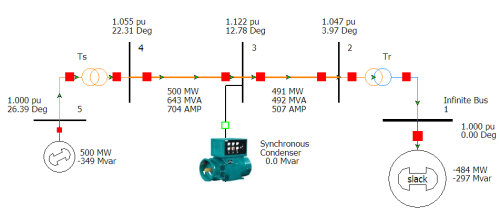
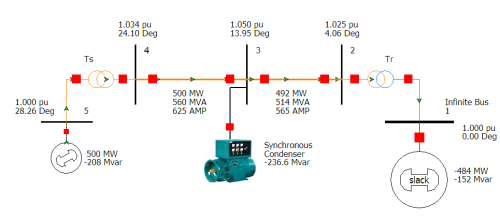
Here are the two circuits in steady state (note that BRK2 is open):
Note that TLine1 has a depressed receiving end voltage due to the current flowing a cross that line (the line inductance cancels out the Ferranti effect), but TLine2 has an elevated receiving end voltage due to the Ferranti Effect. Also note that the reactive power flow at the sending end for TLine2 is negative, indicating that reactive power is flowing “backwards” to the sending end.
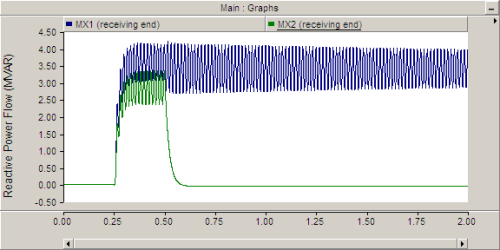
Let’s take a closer look at what’s happening at the receiving end:
The breakers were configured to begin open and close in at 250ms to energize the circuit. Afterward, BRK1 remained closed and BRK2 was reopened at 500ms. We can see that reactive power initially flows across both lines, but when the receiving end circuit breaker is opened, reactive power ceases to flow. Note that the x-axis shows elapsed time of the simulation (in seconds).
The sending end, by contrast, is much more interesting:
When both breakers are opened (until 250ms), there is a significant line charging capacitance drawing reactive power from the system. After the breakers close, the reactive power demand drops significantly (though it is still slightly capacitive due to both lines being lightly loaded). Once TLine2 is opened at the receiving end at 500ms, something interesting happens: the reactive power injected by that line into the system returns to its line-end-open state, while TLine1 increases its reactive power consumption in unison.
In conclusion, it is entirely possible to use a transmission line as a shunt capacitor.


